
Less is the New More!
Fewer words, more flow...
Greater comprehension. Pack in more information with visual shorthand. Use icons or symbols to represent key concepts. Red flag for warning, stop sign for attention, shell game for deception, closed door for secrecy and hurdles for challenges. Use Images to weave a memorable story that ensures the information is stored for greater recall.
Envision symbols.
Case Study
Whistleblowers start out as the company's cheerleaders. Top sales staff fully on board until they discover that the medical device manufacturer misrepresented test results to customers and FDA. In a race to get FDA approval and be first on the market, the company pressures sales staff to sell a defective product. Megaphone to whistle symbols tell the story in a few words. Arbitrator awards salesmen damages including punitive damages.
Envision Flow Charts
Controlling the Flow.
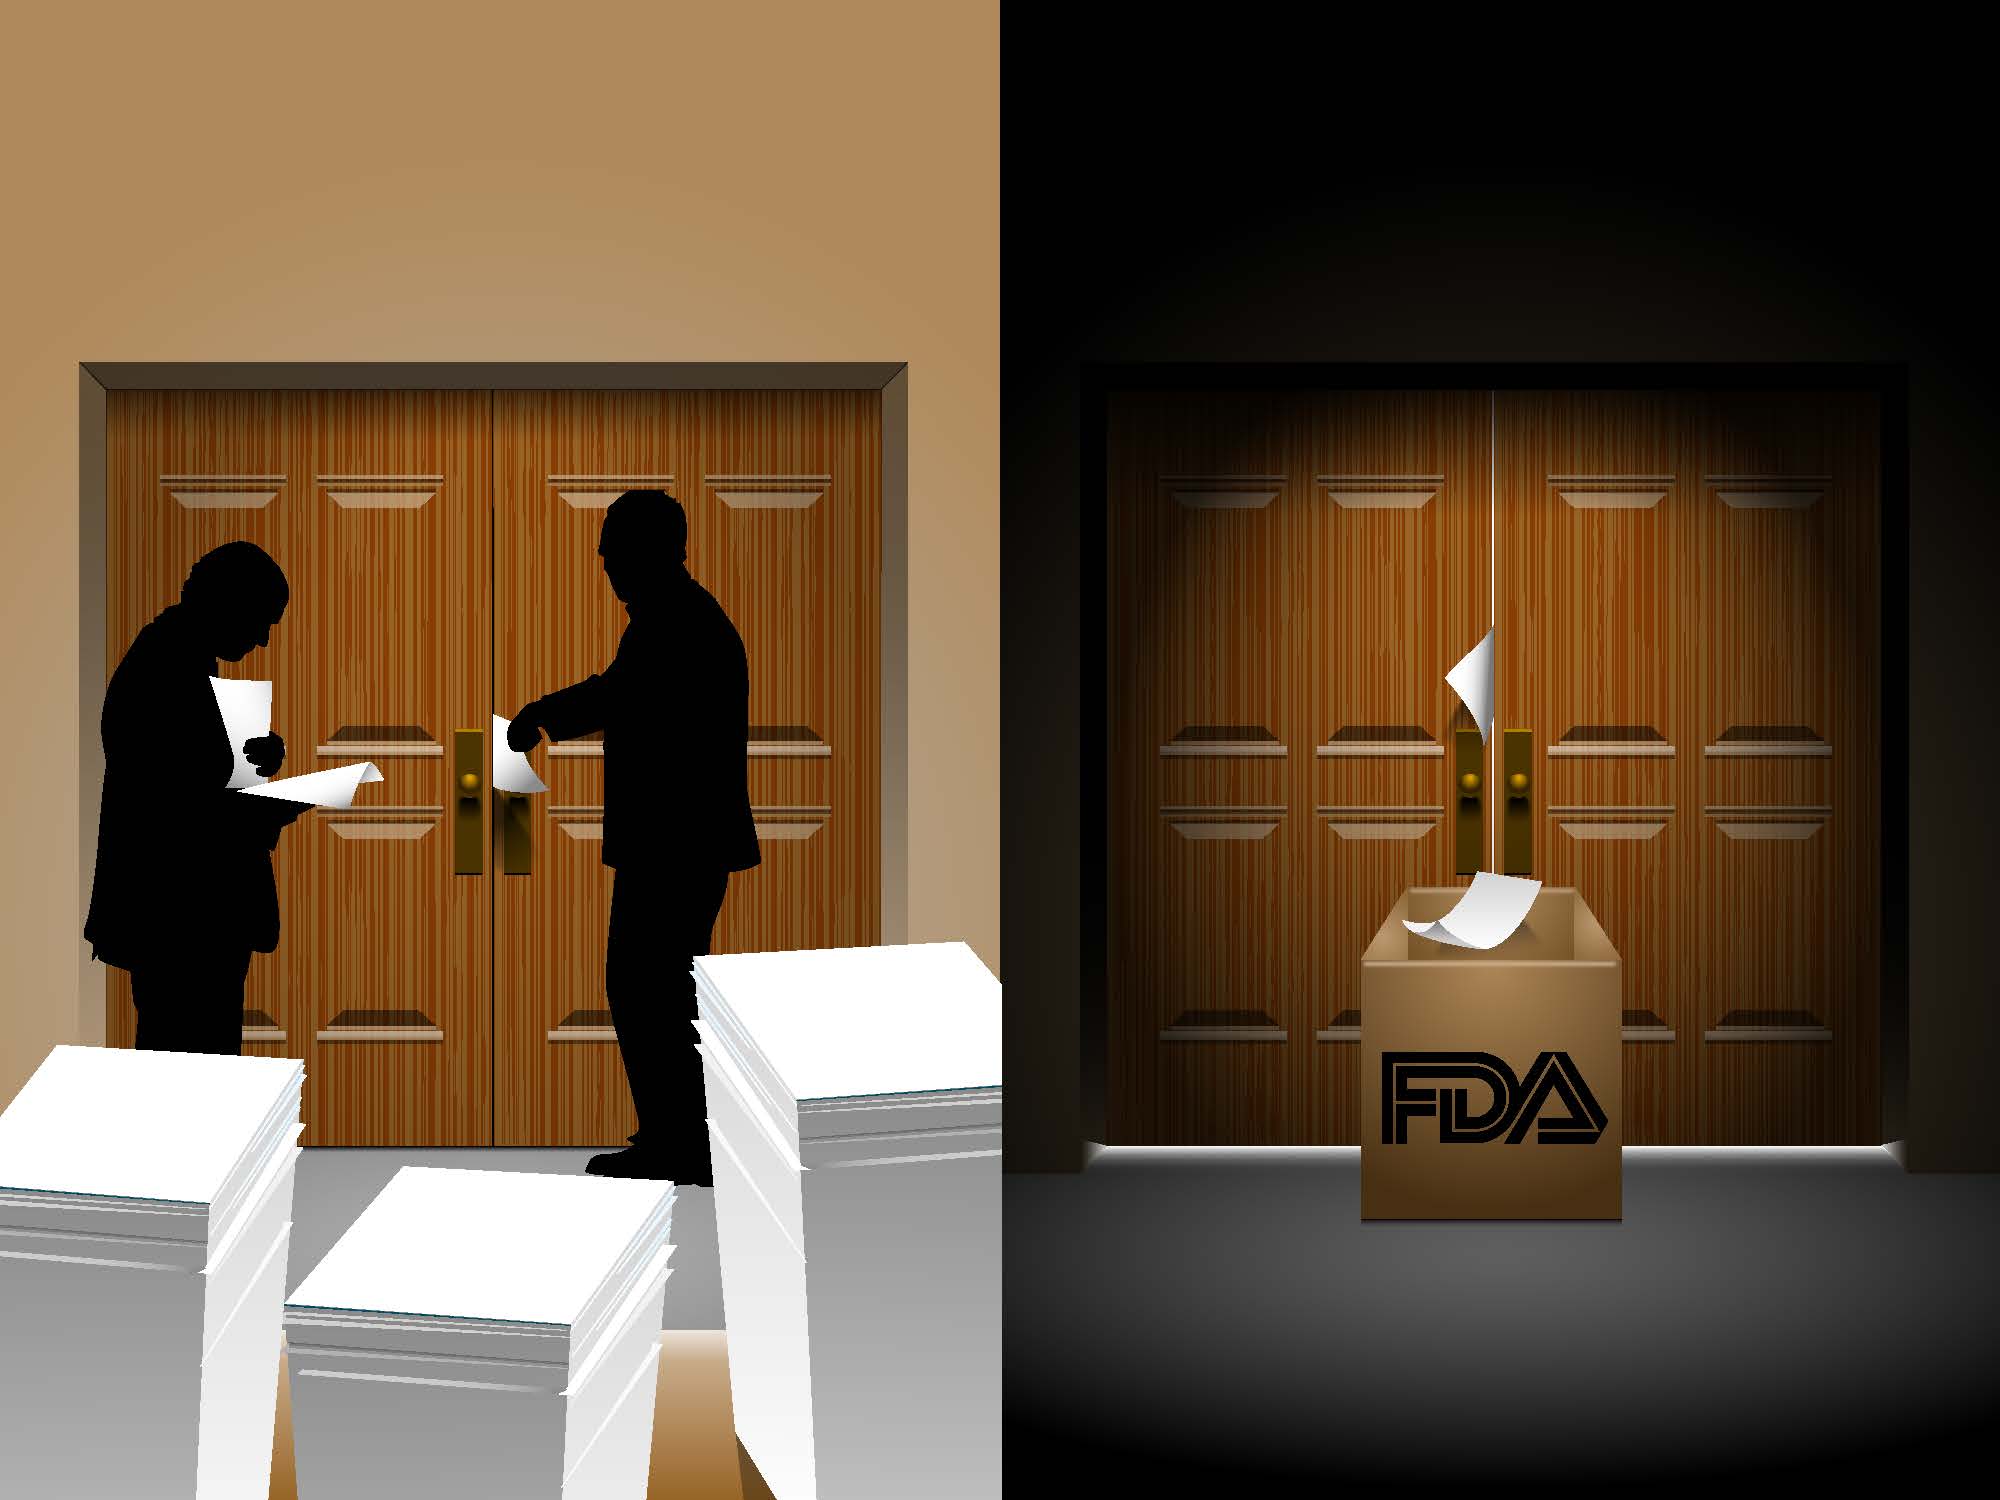
How the information flows is the main point in the "behind closed doors" graphic. Medical device manufacturer cherry picks what research and lab results are fed to the FDA for pending product approval. Lab vs Real world results tell a different story. Less flow = greater comprehension.
"How to" Flow Charts.
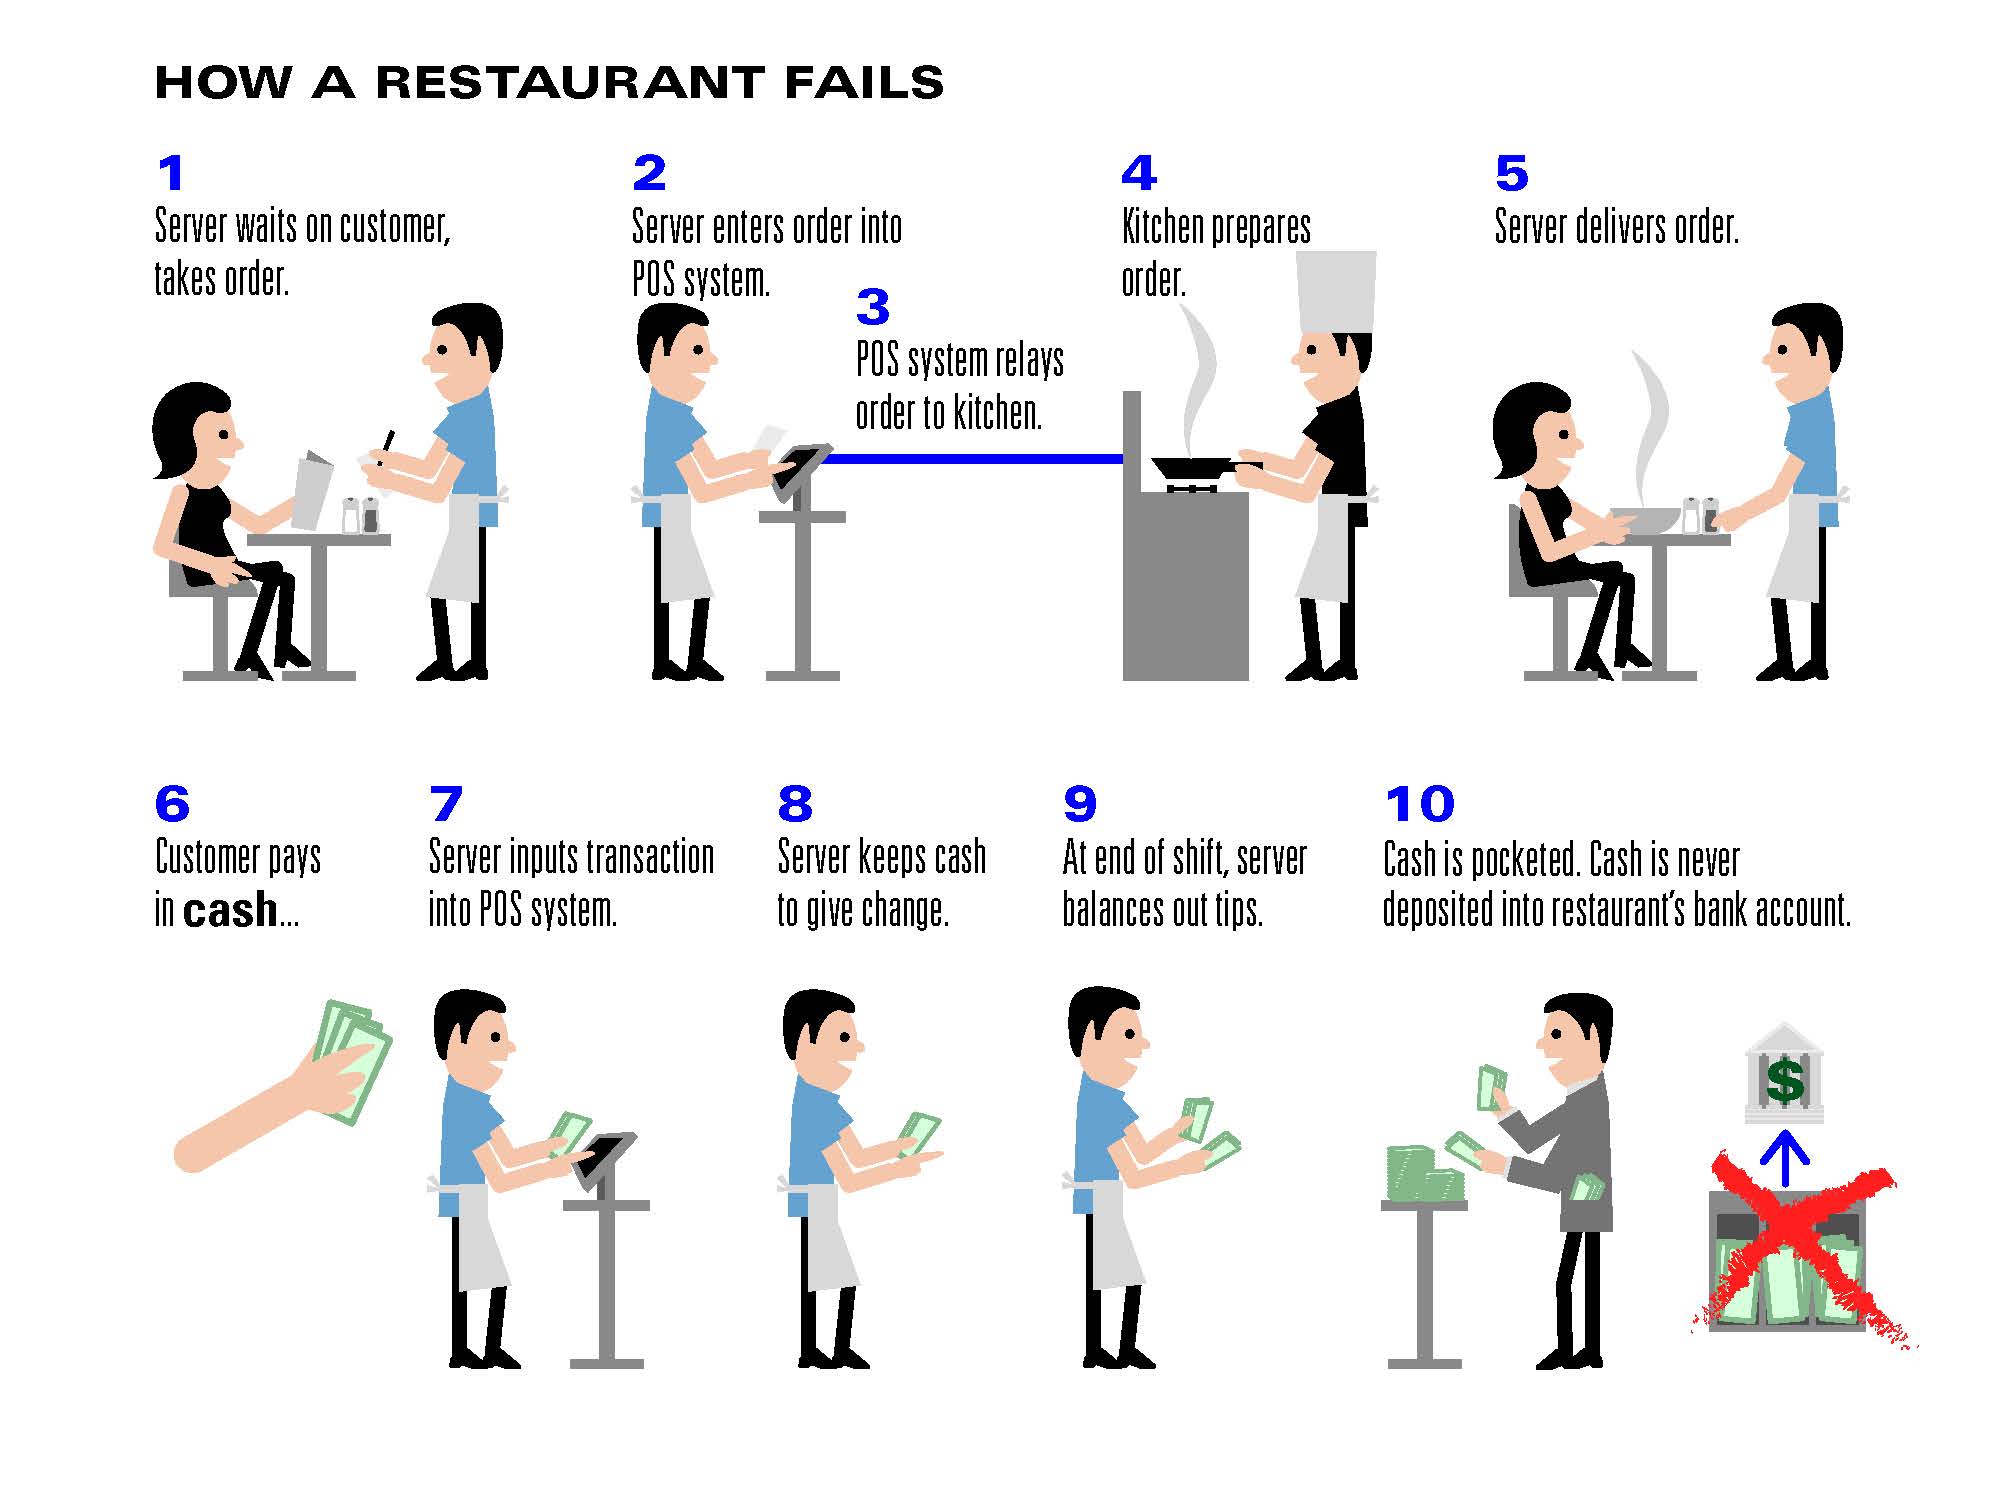
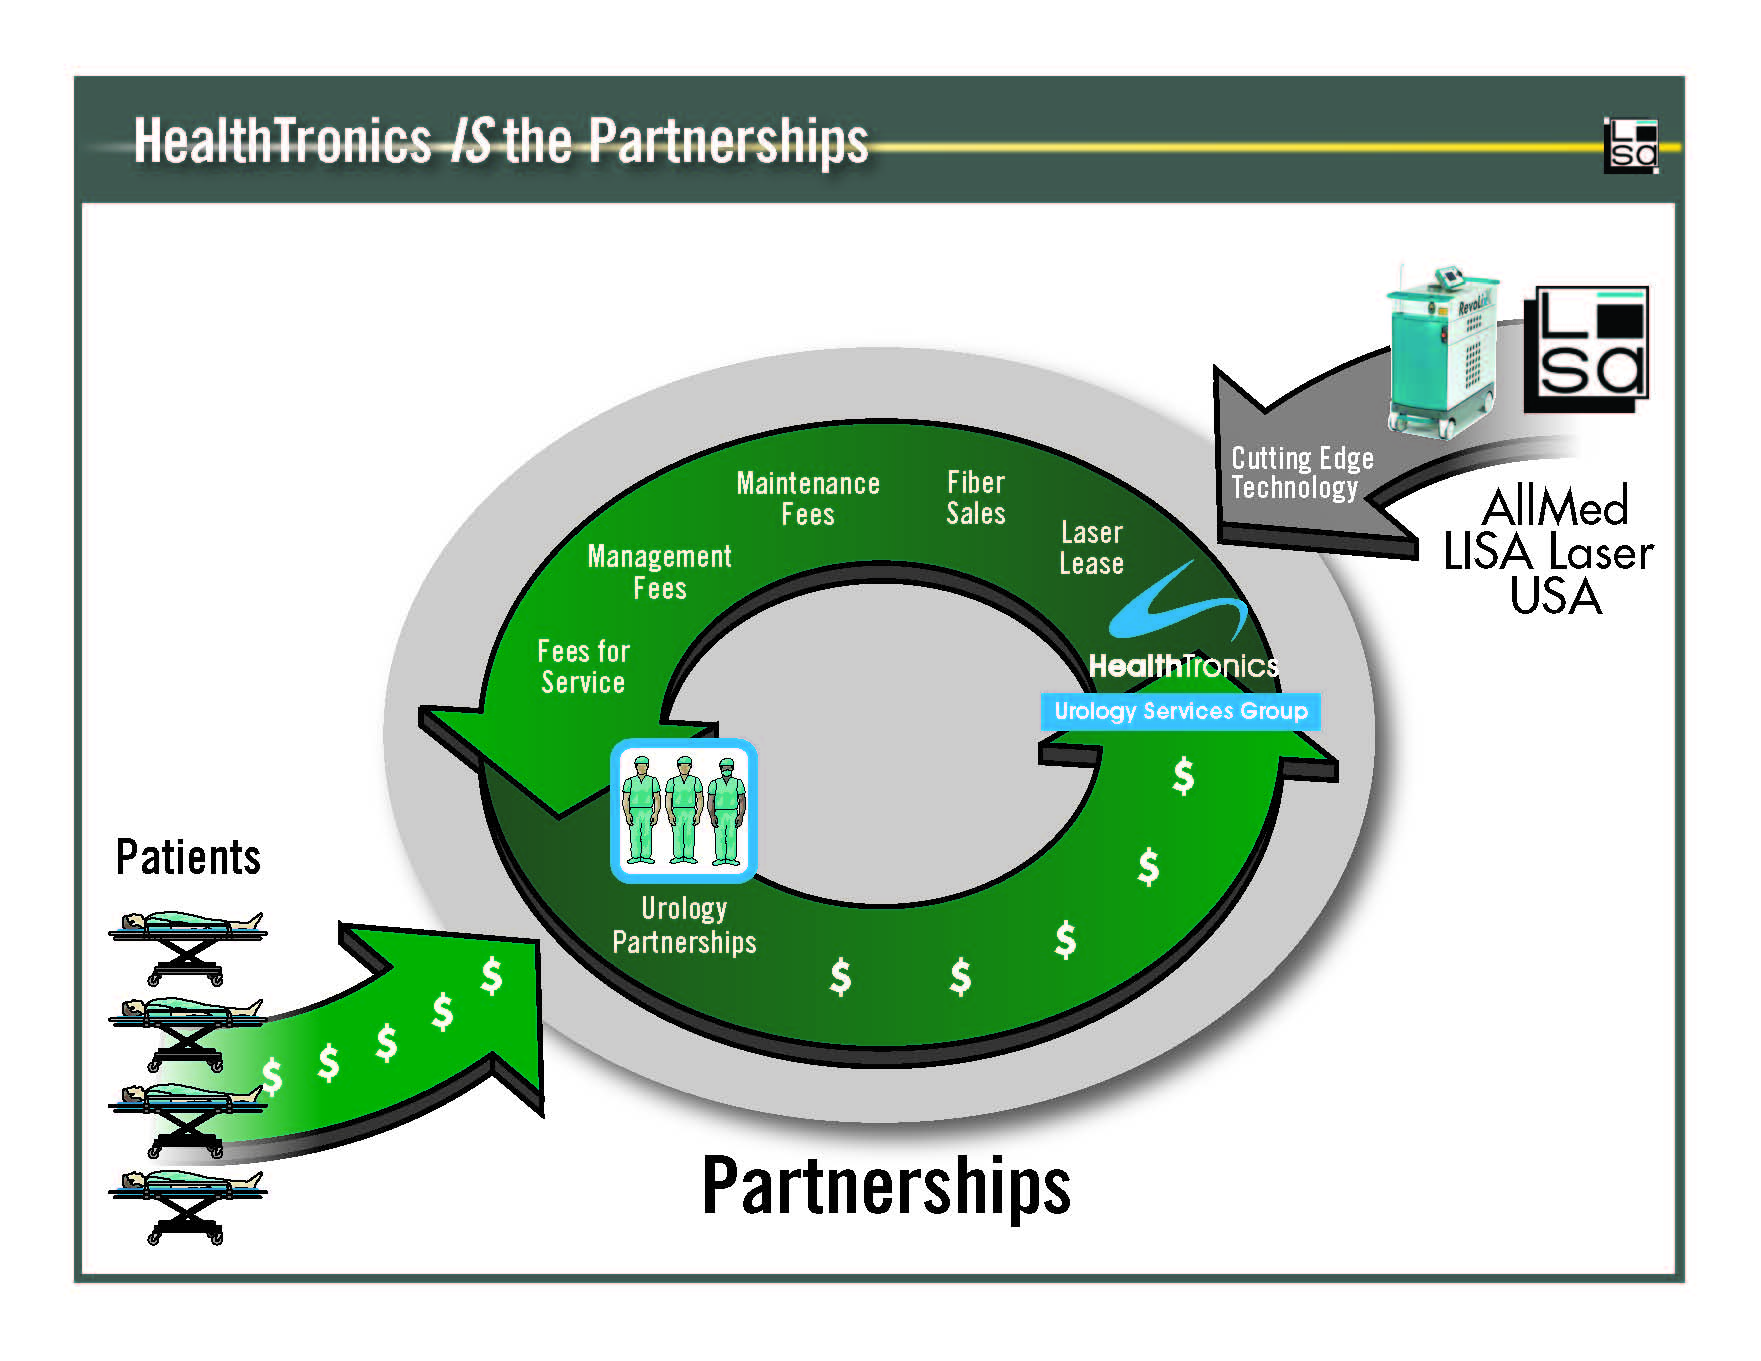
Flow: arrows, point A to point B or numbers can assist the viewer along the pathway. In "How A Restaurant Fails," the money flows into the partner's pocket. In "HealthTronics IS the Partnerships" arrows illustrate the flow of money remains within the same partnership circle. More directed flow = greater comprehension. Jury awarded $9 million in breach of contract and business fraud case.
Icons and Flow Charts.
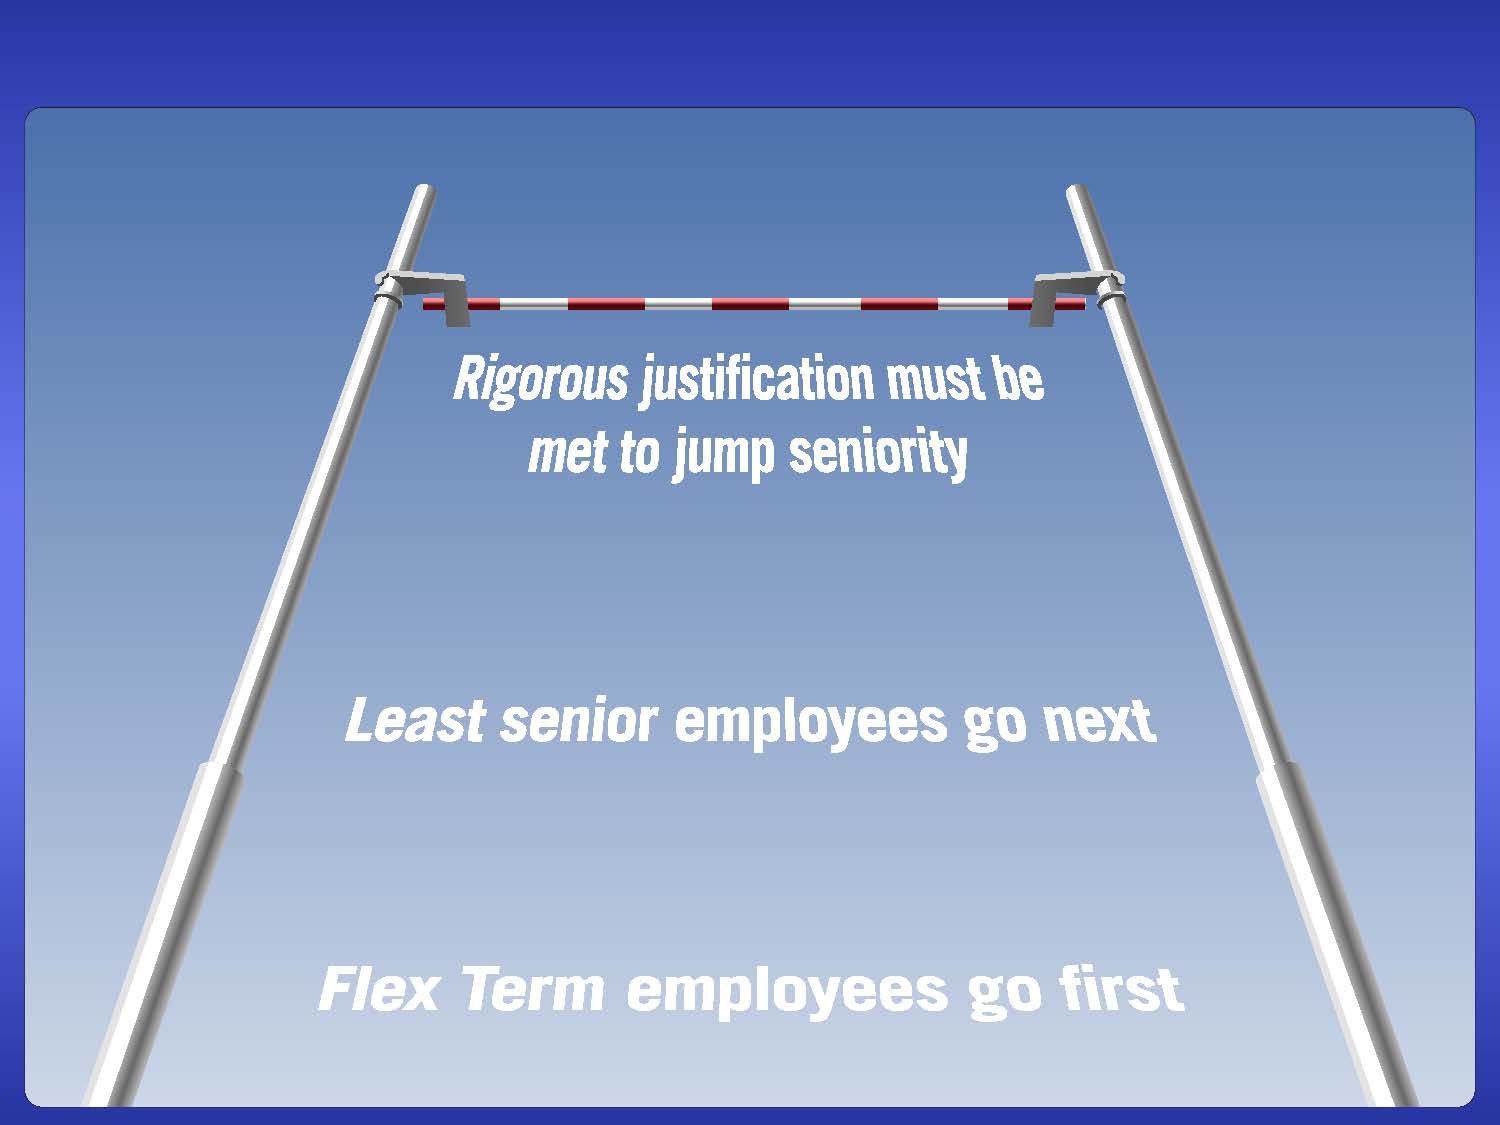
Choose the best image to tell the story. The Lab had a high order to follow when it reversed the order of seniority and laid off 400 employees shortly after the private corporation took over managing the lab. This high jump cost them $37.25 million paid to the 129 class members of government employees in the settlement of a breach of contract and age discrimination case. Jumping the flow = greater results.
Gallery of Flow Charts
Charts that flow.
Call for consultation 415.248.5340